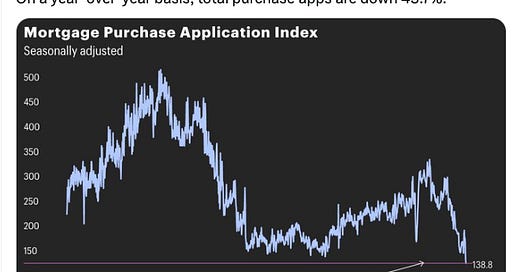
Since early February, Interest rates are back on the rise on stronger than expected economic data. This is impacting the housing market, as the average 30-year mortgage rate is back over 7%, last seen in October when mortgage rates set a two-decade high. Subsequently, mortgage applications are down almost 44% year-over-year, the lowest level since 1995.
Zooming out helps provide some clarity on where we are right now in the real estate cycle.
Disclosure: Chart created by OneJournal Research. Based on monthly periodicity. Data Sources: Federal Bureau of Economic Research, YCharts
According to the National Association of Realtors, the Month’s Supply ratio (dark blue line) “refers to the number of months it would take for the current inventory of homes on the market to sell given the current sales pace.” Currently, there are 8.7 months of supply on the market, but this is not a supply issue, this is entirely driven by crumbling demand.
Regardless of what is driving the month’s supply ratio, over the past 35 years, when the ratio has reached current levels, year-over-year real estate values have entered negative territory. While the current housing market is cooling, year-over-year returns are still positive at 5.8% as of December. This would indicate more pain ahead for home prices.
The good news:
The light blue bars in the chart above are year-over-year home values, and it has basically been nothing but positive since the 2008 global financial crisis. Following the Covid-19 stimulus, the housing market caught fire and was setting year-over-year gains not seen since the 1940s. This is all to say that homeowners are sitting on a nice equity cushion. Median single-family home prices are already 16% off their highs, yet it would take an additional 35% drop just to get back to pre-Covid (January 2020) levels. (see chart below)
March 7th, 2023. Data source: YCharts
The bad news:
Housing is a huge part of the economy, and it moves slowly. Data lags. More specifically, it takes a while for housing data to impact inflation numbers, yet the Federal Reserve has been hinting for weeks that more aggressive rate hikes might be in store. It feels like the Fed should exercise patience to see if a slowdown in housing will provide some relief on inflation, but they may not be afforded that time.
This Market is Different
This is not 2008. This market is unlike previous markets. On a recent earnings call, the CEO of Home Depot noted that 90% of U.S. homeowners either own their home outright or have a fixed rate mortgage below 5%. In fact, 99% of existing mortgages are below current mortgage rates.
The will impact homeowner behavior. There is already a national shortage of homes, and anyone with a mortgage below 3% or 4% is in no rush to sell. This limits the likelihood of homes flooding the market and keeps some pressure on home prices from any drastic correction.
Investment Angle
Cash is king. Debt will become more expensive, so those with cash will have a distinct advantage to take advantage of any discounted prices.
Build. Homebuyers are incentivizing prospective purchasers with all sorts of perks right now.
Real Estate Investment Trusts (REITs). If not looking to make a direct real estate investment, REITs are often in an ETF structure and have been crushed over the past year (down 40% according to the S&P 1500 Office REITs Index), with office REITs leading the selloff on the fear of elevated vacancy rates (see below). There will likely be an opportunity to find some value here in the near future. Something to watch.
It may be an unpopular opinion, but we likely need a reset in home valuations. Real estate for first-time buyers was becoming unattainable for many, particularly in major U.S. cities, and some relief may ultimately be a good thing for the long-term health of the real estate market. With interest rates showing no signs of coming down anytime soon, the slowing real estate market may be a primary reason we fall into a recession in the next 12-18 months.


